Knowing how to use online analytics tools is an important skill for DIY musicians. If you can learn how to play guitar, drums, or piano with two hands, you can do this. The more information you have about your audience, the better decisions you will make about where to focus your marketing efforts. You may decide to adjust your promotional strategy, to focus more on one particular social media channel, or to create a House Party tour to a particular geographical area based on what you learn by analyzing your online presence.
There are many different free tools you can use to gather analytics information. Most are individual tools designed to look at a specific online presence, like your website, Facebook fan page or Twitter followers. “Analytics for Musicians” by Make It In Music gives a good overview of analytics tools for these three: Google Analytics for your website, Insights on Facebook, and Hootsuite for analyzing Twitter.
This post describes how and why you might want to check out Google Analytics to understand the activity on your band website. Even if you are a bit of a technophobe, making the effort to personally understand what’s going on with your website is enlightening and empowering. Instead of just anecdotal conversations you might have with fans after a show, or arguments with your bandmates about which website pages are most important, analytics give you real and actionable information about how people are discovering and engaging with your music and your band. You won’t be held hostage to someone else, either, like a webmaster, relying on their busy schedule and waiting for them to give you information.
Setting Up Google Analytics
If all you have is a Facebook or ReverbNation page, and you don’t yet have a band website, you can stop reading right now and go build a website for your band. If you’re still not sure why you need a website, read this: “3 Reasons To Drive Fans To Your Website (and Not Social Media)” by Chris Vinson of Bandzoogle. If you have built your band website using a service like Bandzoogle or CDBaby’s HostBaby, Google analytics are available through their dashboards. They give you the same data I discuss below, although usually packaged up prettily and in less detail than using Google Analytics directly.
If you have a self-hosted WordPress website (.org), Joomla or any other self-hosted platform, you can and must install the Google Analytics tracking code directly on your site before accessing the Google Analytics stats. If you have paid a web developer to create your website, they should have installed Google Analytics on your site from the beginning. If they didn’t, ask them to install it ASAP. Your webmaster can give you access to your website’s Google Analytics by authorizing your gmail address. Some website developers will also give you an Analytics report on a regular basis (and charge you for it), but I encourage you to access the data directly yourself.
You (or your webmaster) have to set up Google Analytics first and give it some time to gather statistics. Once you have had Google Analytics up for a while (preferably months), and you have gotten access, you can log in to Google using your gmail address, and check your stats at the site http://google.com/analytics You should see your website name and UA code and below it, a little globe, which you click on to take you to your Google Analytics dashboard.
Key Metrics For Musicians
Google Analytics can seem overwhelming. (If, on the other hand, you like this geeky stuff, you can export your Google Analytics data into Excel for further analysis – but you probably already knew that.) Here are some of the most important things I think you can learn from looking at the Google Analytics for your website. I’ve italicized the left hand menu navigation that I used to get at the information discussed:
- The big picture view of your website traffic over time: Overview. In the top right
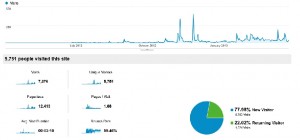 corner of Google Analytics is the date box. Default is the last month of data. By playing with the dates, you can see traffic for a specific week, month or year. An often overlooked tool is the “Compare” box, which allows you to compare traffic from two periods, say last month and this month, or the same month last year compared to this year (for example February 2012 and February 2013). Note when there were big spikes in your website traffic. By hovering your mouse over the spike on the graph, you can see the date. Try to trace this spike to a particular promotional activity, such as a blog or Facebook post, a show, posting a new video to your website, a RT about your band from someone famous, or a press article ore review that was published that day about your band.
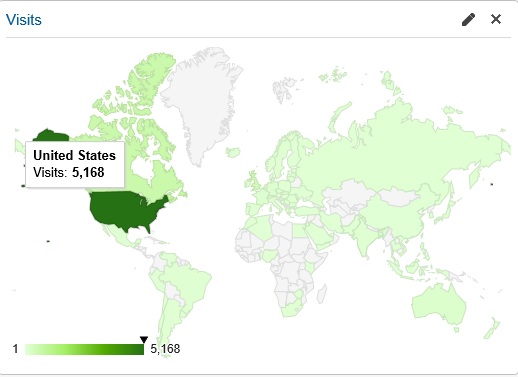
 - Where your traffic comes from geographically: Audience > Overview > Demographics > Location This is pretty self-explanatory – it’s where in the world your fans reside. I was talking to Brian Thompson of Thorny Bleeder the other day about website analytics for a client he is working with. Brian was using another analytics tool called GoSquared, instead of Google Analytics, because it provides a nice visual dashboard, but the data is similar. Brian noted that although his client is a US-based band, they had a lot of website traffic coming from Europe. They were not aware of the high level of interest coming from that continent, and this gave them a better idea of where to leverage and focus their marketing efforts for their new release.
- Where your traffic comes from via search: Traffic Sources >
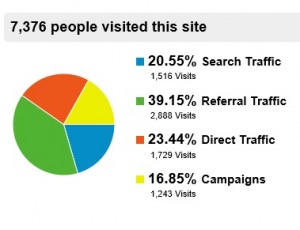 Overview This tells you how people arrive at your site, whether through search (Google, Bing, Yahoo), referral (from social media or any other website), direct link (someone typed or copied the URL into their browser), or from a campaign (for example, email). The Overview also tells you what Keyword search terms people are using to find your website. My top keyword search is my name, which is logical from a branding perspective. What I find interesting also is the Referral Traffic > Source information, which shows me that more traffic comes from Facebook than I would have thought.
 - Where your traffic comes from via social media referrals. Traffic Sources > Overview > Social This tells you both how much of your website traffic comes from social media, and where exactly it comes from. Only about a quarter of my total traffic comes from social media referrals, and my top social media referral sites are Twitter and Facebook. One of the things I noticed is that very little referral traffic comes from YouTube to my website, which means I probably need to do a better job of highlighting my website URL at the top of the information about my music videos.
- Which pages on your website people look at the most: Content > Overview It’s good to know which of your website pages gets the most traffic. There are a few articles on famous musicians and their marketing efforts (I’ve written about Taylor Swift, Macklemore, and Amanda Palmer) that have drawn people to my blog more than others. For your website, seeing which pages get the most traffic and where it’s coming from can give you insight into the reason people are coming to your site. Is it the home page (“/” or the root), the Music or About page, or Videos? One thing to check is that if you use WordPress, your individual blog post URLs (“permalinks“) are automatically created with the date and title of the post. This is a great place to cross-reference the traffic spikes I mentioned above with a specific post on a specific date.
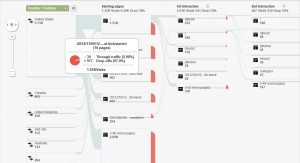
- How people navigate through your website: Audience > Visitors Flow I think this a really cool page that most people don’t look at. It shows graphically how people travel through your site – which page they come in to, where they go next, and where they leave the site from most often. Spend some time looking at this page to understand how people use your website, how deep they go (or not), and which pages they are clicking on in what order.
- Real-Time and In-Page analytics: Real-Time and Content > In-Page Analytics (Geek alert) It can be quite addicting to watch the stats change on your website in real time, as visitors enter and leave. This is something that’s fun, but it’s not that useful – unless you are holding a live streaming event, like a webcast, that has a link which you have promoted directly from your website. In that case, you might want to watch how many people are tuning in live and from where. Also helpful, but equally geeky, is looking at the In-Page Analytics to see where on a page people are clicking most. This is useful when you are considering a website re-design, because it shows you what parts of your home page, for example, are clicked on the most. Most people read sites in an “F” pattern, so making sure the most important information is across the top or down the left hand side of your site is critical.
I’ve really only scratched the surface of Google Analytics with this post, and I’m sure there are some even more expert folks out there who have their favorite statistics to look at. My goal was to get you intrigued enough to get past the inertia and at least make the effort to install and view some of your website stats yourself.
Have you used Google Analytics? What features and information do you use most? What is most useful about Google Analytics for your band? Do you use other tools like GoSquared or Statcounter (there’s also recent article by Grassrootsy on web analytics using Statcounter). I’d love to hear your feedback!



5 comments